If you want to change chart colors in a permanent
way, i.e. that it is remembered after refresh or change the cube you
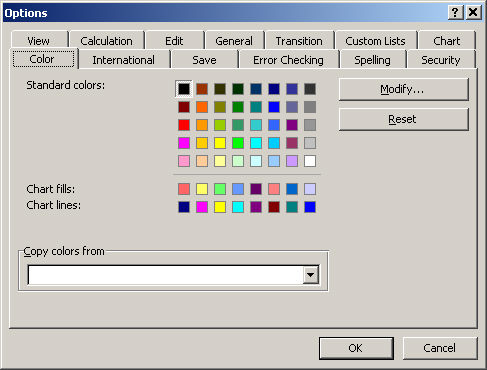
must change the workbook's default color scheme and not change it
in the graph. Open the Tools menu and choose Options and select the
tab "Colors".
Select the Chart fills and/or Chart lines that you wish to change
and click Modify. Select the color you want instead.
If you don't get the measures fields in the correct order for instance
like red - yellow, green, blue, don't add the measures into the chart
area. Go to the Pivot table sheet and add the measures in the order
that you want. Now you can switch back to the Pivot Chart sheet.
Go to the Pivot table and in the Pivot Table menu click Pivot Table
and choose Table options. Here you can select it to Refresh on File
Open. You can even select to update it every X minutes if you want.
In order for Excel to always automatically include new data in your
table / chart you must "drill-down" from the top-level by
right-clicking on the "header"field and choose "Show
Details".
Excel treats this as "always" show me all data on this
level, as if you where to expand by zooming in on the years / quarters
it means expand only the ones that I've double-clicked on.