
In the future, we don’t talk about visibility but about hyperautomation
BY HANS BERGGREN
This article was originally published in Supply Chain Effect no 6/2023.
After many years of predictions that supply chain visibility will mean the big breakthrough for responsive and resilient supply chains, I meet more and more people who, just like me, question this. Why? The most important reason is that “no one has time for visibility”. We must therefore redefine supply chain visibility. It is not about making data visible to humans, but about making large amounts of data available (“visible”) via a high degree of digitization for AI/ML, event-driven machine monitoring, classic data analysis, etc. that handle the majority of decisions. I am talking about Hyperautomation.
No one has time to “visually” ascertain what the situation looks like and based on this draw conclusions and decide on measures. In this regard, I believe that we have been thinking completely wrong when we have talked about supply chain visibility over the years. Many software solutions with graphic interfaces for visibility have been launched based on the idea that people should be able to receive warnings and visual guidance and act based on the visualization. The same applies to certain sub-segments of supply chain flows. For example, track & trace for transport, which is well developed in the consumer goods industry, but which requires you to either actively search for your goods or receive information via push notifications about where your goods are.
Turn the question around
This type of visibility is not interesting when we are talking about large, intensive supply chain flows business-to-business. The flows that are connected via all involved players’ systems for forecasting, production planning, material planning, purchasing, inventory optimization, and more. We need to turn the whole issue around and talk about the degree of digitization and the breadth of data collection from digitized flows, which forms the basis for AI/ML-based analysis and related automated inferences and automated decisions. AI/ML also supports the verification of its own automated decisions in an ongoing quality assurance and revision.
Visibility via graphical interfaces?
Creating visibility via graphical interfaces is also needed in the future. Both in the first stage – for which flows and based on which criteria we should use AI/ML for automated decisions – and in the ongoing evaluation of the AI/ML-based decisions. For example, to see if certain data starts to deviate significantly from the pattern that initially qualified the flow for AI/ML-aided decisions. In both preliminary stages and ongoing evaluation, a deviation-based visual support for human decision-making is therefore critical. Humans are still the best at making decisions in the event of unforeseen disruptions. This applies not only to dramatic unforeseen events, so-called “black swans” such as wars, natural disasters, accidents, pandemics, etc., but also unforeseen events of a less importance.
AI/ML for sharper forecasts
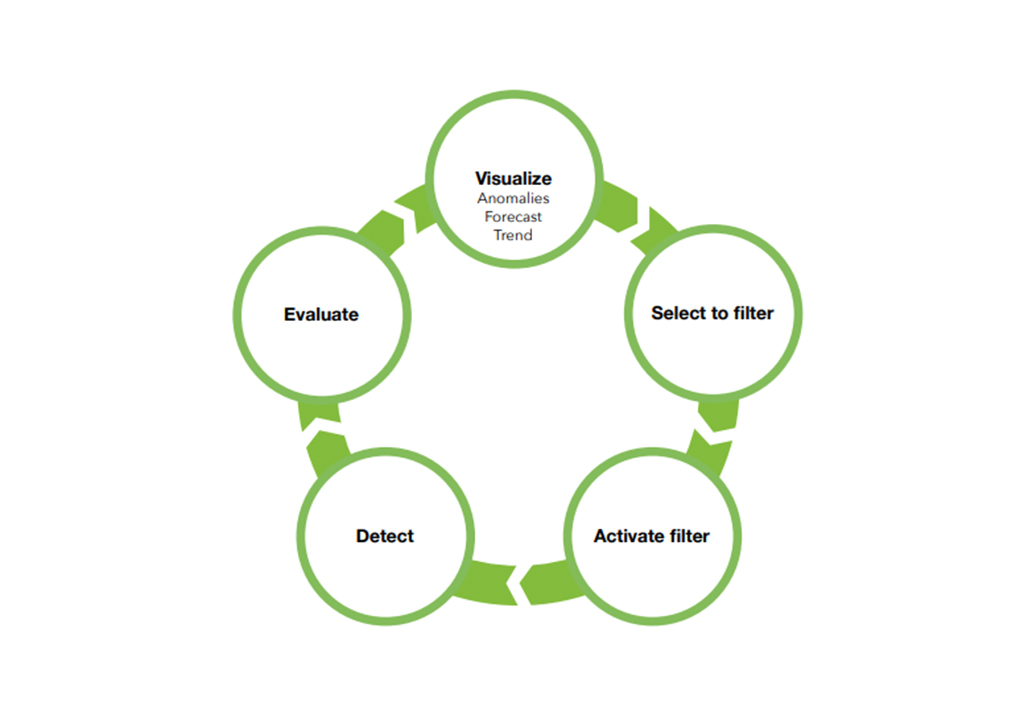
In our group of companies, we are experimenting intensively in this area and have just launched AI/ML support to help our customers better understand the forecasts of the major players in the automotive industry (truck and car manufacturers). We have also made it possible for our customers to be able to choose for the AI/ML service to adjust the forecasts (filter them) for certain flows that qualified for this. The AI/ML service evaluates itself, learns and improves continuously. The service progressively visualizes additional flows that qualify for inclusion in the AI/ML adjusted forecasts, as well as flows that are already included but should be questioned whether they should actually be removed from the AI/ML alignment for various reasons.
The entire concept can be extended after some time to cover not only the forecast flows of the standardized automotive industry, but also the forecast flows of other industries as long as the scope and master data are sufficient in both quantity and quality.
More services and processes
If we fast forward the film a couple of years, it is my assessment that we will be able to apply this method to more of our services that cover other types of processes than forecasting.
I am also convinced that we will be able to apply the corresponding reasoning and solutions to our internal processes where we work with large amounts of data, behavior patterns, trends and anomalies.
I am happy to share our experiences and take part in others’. If you find the content of this article interesting, please get in touch to jointly explore the further possibilities in the exciting field of hyperautomation!
Hans Berggren is group CEO of PipeChain
Insights

If you are interested in learning more about how to create a powerful connected supply chain, here are our latest insights.
Tech papers
To help you get a deeper and better understanding of our solutions and your supply chain, we have developed a number of detailed tech papers on different subjects.


-
Necessary
These cookies are not optional. They are needed for the website to function. -
Statistics
In order for us to improve the website's functionality and structure, based on how the website is used. -
Experience
In order for our website to perform as well as possible during your visit. If you refuse these cookies, some functionality will disappear from the website. -
Marketing
By sharing your interests and behavior as you visit our site, you increase the chance of seeing personalized content and offers.